Cluster
PSZ2G357.43+69.50
RA: 209.965 · Dec: 14.251 · z: 0.209 · M500: 5.656 × 10¹⁴ M☉
To download the raw data for this cluster, you can Search ChaSeR. Following this link will copy the cluster name to your clipboard. Paste it into the “Target Name” search box, click “Resolve Name”, then click “Search” to return all relevant observations.
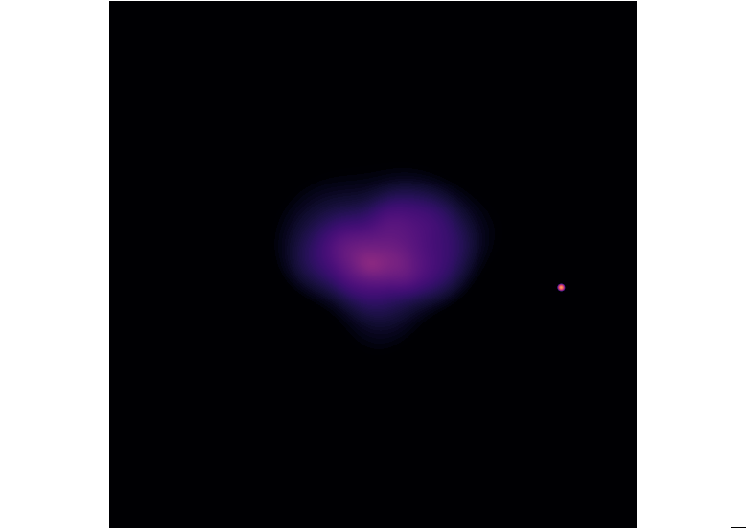
Download a FITS file containing the adaptively smoothed cluster image shown above: PSZ2G357.43+69.50_adaptively_smoothed.img
Emission Measure Profiles
Here is the best-fit emission measure profile:
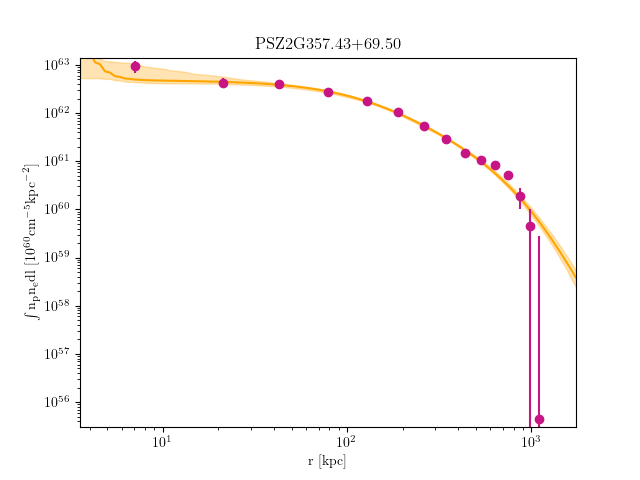
The EM data points are available in file format here: PSZ2G357.43+69.50_EM.txt
The columns in this file are: (1) \(r_{\rm inner}\) (pixels), (2) \(r_{\rm outer}\) (pixels), (3) kT (keV), (4) Z, (5) EM \((\int \mathrm{n}_p \mathrm{n}_e \mathrm{dl}~[10^{60}~\mathrm{cm}^{-5}~\mathrm{kpc}^{-2}])\), (6) EM\(_{\rm low}\), (7) EM\(_{\rm high}\).
The best-fit density model can be downloaded here and the best-fit EM model can be downloaded here. The first column in each file is the radius (in kpc) and the second column is the model evaluated at that radius (in \(\mathrm{cm}^{-3}\) or \(\mathrm{cm}^{-5}~\mathrm{kpc}^{-2}\)). The models have been evaluated from the midpoint of the innermost density bin to the midpoint of the outermost density bin.
Temperature Profiles
Here is the best-fit temperature profile:
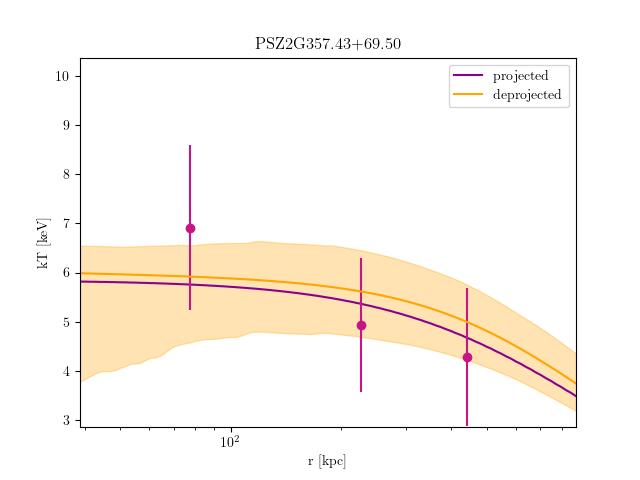
The temperature data points are available in file format here: PSZ2G357.43+69.50_kT.txt
The columns in this file are: (1) \(r_{\rm inner}\) (pixels), (2) \(r_{\rm outer}\) (pixels), (3) kT (keV), (4) kT\(_{\rm low}\) (keV), (5) kT\(_{\rm high}\) (keV), (6) Z, (7) Z\(_{\rm low}\), (8) Z\(_{\rm high}\), (9) EM \((\int \mathrm{n}_p \mathrm{n}_e \mathrm{dl}~[10^{60}~\mathrm{cm}^{-5}~\mathrm{kpc}^{-2}])\), (10) EM\(_{\rm low}\), (11) EM\(_{\rm high}\).
The best-fit deprojected temperature model can be downloaded here and the best-fit projected temperature model can be downloaded here. The first column in each file is the radius (in kpc) and the second column is the model evaluated at that radius (in keV). The models have been evaluated from the midpoint of the innermost density bin to the midpoint of the outermost density bin.
All Models
All models can be found in a combined table here. The columns are: radius, density, EM, kT (deprojected), and kT (projected).